Here’s how CleanLight was the ideal solution for the energy recovery business ENVA.
The Challenge
The 24-hour operations of ENVA’s waste processing site in Leicester, UK mean that welfare facilities are in constant use. Because of the nature of the work undertaken on site providing clean air through either mechanical or natural ventilation is difficult. Suppression methods are used to manage dust and other airborne particles, however, these focus on avoiding spread beyond the site, into the surrounding area. This means that air quality inside welfare spaces cannot be maintained when the outside air is potentially worse than the air inside. This constant use of the spaces means that social distancing is impractical. In addition to air contamination caused by the operation of the site, the potential for cross-transmission of airborne illnesses, such as influenza and COVID-19 would have a serious operational impact on the business. The welfare of staff and mitigation of loss in productivity is of high importance to the organisation.
The area had no provision for mechanical air handling with no fresh air intake or extraction installed. With the room in constant use and windows that are impractical to open, there was no solution for managing poor air quality or increased CO2 levels. The canteen is air conditioned to maintain air temperature and comfort for staff.
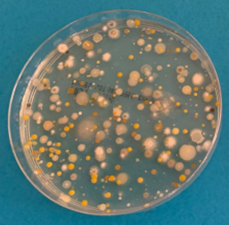
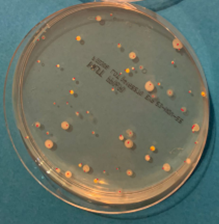
This was evident in the CO2 level readings and bacteria collections carried out during the “before” phase of the Air Quality Audit. Throughout the testing period, CO2 levels were close to and in excess of 1500ppm. In addition to this, the levels of bacteria collected through the use of settle plates were so great as to be impossible to provide an accurate count. The HSE states that ”CO2 levels consistently higher than 1500ppm in an occupied room indicate poor ventilation and you should take action to improve it.” Work conducted by a WHO expert group on assessment of health risks of biological agents in indoor environments suggested that total microbial load should not exceed 1000 CFU/m3. If higher than this, the environment is considered contaminated.
The Solution
Following the completion of the Air Quality Audit, a lighting design was created that replaced the existing lighting configuration ensuring lighting levels were delivered in line with CIBSE guidelines. This ensured consistent coverage of CleanLight panels that Lightico calculated to deliver the equivalent of 3.07 ACH (air changes per hour).
Through the simple replacement of the existing lighting, the CleanLight panels are now providing clean air without the need for the business to invest in the installation and operation of filtered mechanical ventilation.


“We saw the case studies provided by Lightico so we’re confident that there would be an improvement in air quality when we installed CleanLight. However, we didn’t expect the visible reduction shown in the air quality audit. CleanLight has transformed the space, making it cleaner and safer for our team members!”
Simon Haywood — Operations Manager, ENVA
The Results
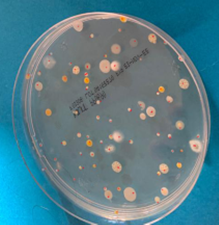
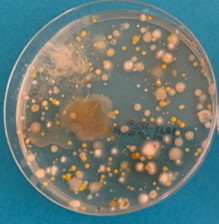
Following the installation of CleanLight the “after” stage of the Air Quality Audit was completed. From this, a significant improvement in air quality was identified when measuring both CO2 levels and bacteria counts. This not only will reduce the potential risk of the transmission of airborne pathogens but also means that the business will no longer need to act on high levels of CO2 causing a short-term impact on productivity.
By not being forced to install mechanical air handling to maintain air quality the business has saved both a large, upfront capital investment as well as an increase in operating costs and carbon emissions. Through the use of LED lighting, and replacing existing legacy light fittings, the total operational cost savings are estimated at over £370 per year, simply through the installation of 3 lights in an 8m x 4m room.
Plate location | Bacterial colony count (per plate) – CFU |
| ||||
Before Cleanlight | After CleanLight | % Diff | ||||
CFU | CFU/m3 | CFU | CFU/m3 | CFU | CFU/m3 | |
Location 1 | Uncountable | 70 | 743 | N/A | ||
Location 2 | Uncountable | 55 | 584 | N/A | ||
Location 3 | Uncountable | 71 | 753 | N/A | ||
Average across the location | Uncountable | 65 | 693 | N/A | ||
Bacteria collected after CleanLight was installed are now below WHO contamination levels. CO2 levels were also on average, 27% lower.
Time | Fixed CO2 Monitor | |
Before CleanLight | After CleanLight | |
Start | 1,304 ppm | 1,191 ppm |
15 mins | 1,401 ppm | 1,011 ppm |
30 mins | 1,079 ppm | 932 ppm |
45 mins | 1,473 ppm | 878 ppm |
60 mins | 1,532 ppm | 921 ppm |
1 hr Av | 1,357 ppm | 986 ppm |